Marketing Dashboard: Guide and KPIs
A marketing dashboard centralizes key marketing indicators. Definition, essential KPIs, how to build one and which tools to use.

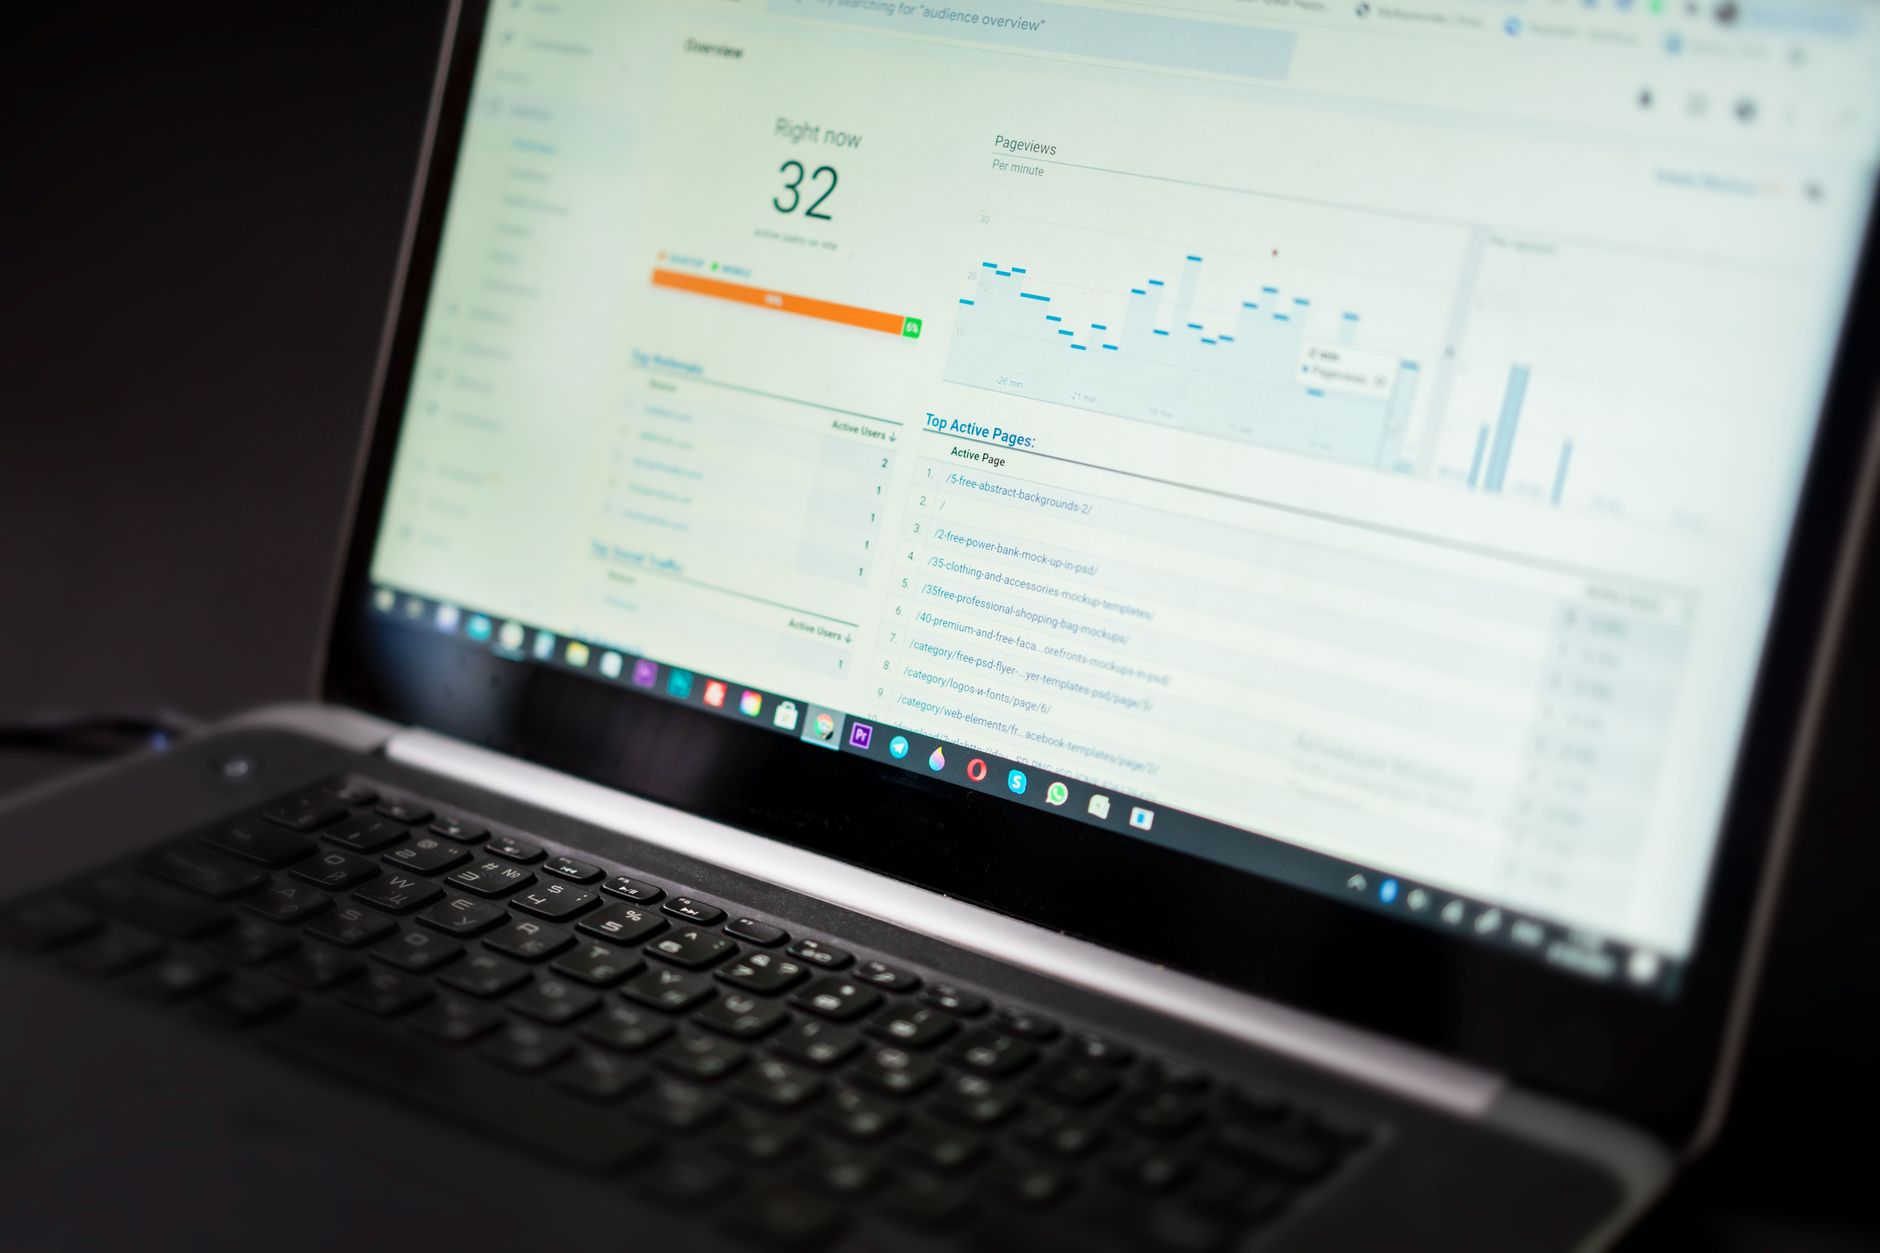
A marketing dashboard brings together in one place the indicators used to track the performance of acquisition, conversion and retention actions. Built from sources as varied as web analytics, advertising platforms or a CRM, it replaces the manually updated spreadsheet with a continuous view shared across teams. This guide covers its definition, the indicators to prioritize, a step by step method for building one, plus the tools and the most frequent mistakes to avoid.
What is a marketing dashboard?
A marketing dashboard is a visual steering tool that centralizes key performance indicators coming from the different acquisition channels, website, social media, paid advertising and customer relations, to track at a glance whether set objectives are being met. It helps spot a traffic or cost anomaly quickly, then adjust strategy based on up to date data rather than a general impression. Unlike a one off export sent by email, it updates automatically each time the connected sources synchronize.
The primary function of a marketing dashboard comes down to three verbs: centralizing data scattered across several tools, steering the achievement of objectives by spotting gaps, and supporting decisions with up to date figures rather than an estimate. This centralization becomes especially useful as channels multiply: a site built around organic search, active advertising campaigns and a presence on social media each generate their own metrics, difficult to compare without a common reference point.
A marketing dashboard is finally distinguished from a one off report by its continuity. A report answers a specific question at a given moment, while a dashboard remains available at all times and reflects the most recent state of the tracked indicators, making it a monitoring tool rather than a fixed snapshot.
Why a marketing dashboard is essential for steering performance
The growing number of acquisition channels makes measuring marketing performance more complex than before. Organic traffic, advertising campaigns, social media and email actions each produce data in their own interface, which makes a consolidated reading difficult without a dedicated tool. A marketing dashboard directly addresses this problem by bringing these sources together into a single, regularly updated view.
This consolidation generally relies on the data already collected by the web analytics tools used day to day. Rather than duplicating an existing measurement, the dashboard organizes it and puts it into perspective alongside the other channels tracked, which makes budget arbitration between levers easier.
A well designed marketing dashboard also reduces the time spent producing manual reports. Once sources are connected and indicators defined, updates become automatic, freeing up time for analysis rather than for compiling figures in a spreadsheet.
The key indicators (KPIs) to include in a marketing dashboard
The choice of indicators determines how genuinely useful a marketing dashboard turns out to be. Too many metrics dilute attention, while too narrow a selection deprives the team of useful signals. Tracked indicators generally fall into three complementary families.
Acquisition and traffic indicators
Website traffic, measured in unique visitors and sessions, remains the first indicator tracked by most marketing teams. It is complemented by the breakdown of acquisition sources, organic traffic, paid campaigns, social media or email, which helps identify the channels that are genuinely delivering rather than judging the site’s overall performance.
Conversion and cost indicators
The conversion rate, meaning the share of visitors who complete an action defined as an objective, purchase, sign up or download, measures the real effectiveness of a journey rather than its traffic volume alone. The conversion rate calculation covers the formula and the precautions to take when comparing this indicator across several periods or channels. Cost per acquisition, which relates the budget spent to the number of new customers or prospects obtained, completes this reading by adding the financial dimension.
Engagement and retention indicators
Engagement indicators, an email open rate, time spent on a page or interaction rate on a social network, indicate the quality of the relationship maintained with an already acquired audience. Retention rate or bounce rate complete this family by signaling whether visitors or customers already reached stay engaged over time rather than turning away after a first contact.
How to build a marketing dashboard step by step
Building a marketing dashboard follows a repeatable method, which limits the risk of producing an overloaded tool that ends up rarely consulted.
Define objectives and priority KPIs
The first step consists of formulating the business objective the dashboard is meant to serve, before choosing a single indicator. A brand awareness objective does not call for the same indicators as a lead generation or retention objective, and this clarification avoids stacking up available but ultimately unhelpful metrics for the decision at hand.
Identify and connect data sources
Each objective relies on one or more data sources to connect: a web analytics tool for traffic, advertising platforms for campaigns, a CRM for sales tracking. A tag management tool such as Google Tag Manager makes this collection easier by centralizing the deployment of tracking tags without repeated intervention on the site’s code, which makes the data feeding the dashboard more reliable.
Choose the right visualization tool
The choice of tool depends on the volume of data to process and the level of customization sought. A spreadsheet is enough for occasional tracking or a small structure, while a dedicated visualization solution becomes necessary once several sources need to be cross referenced regularly or the report must be shared across several teams.
Design a clear, actionable layout
The layout of indicators should follow a reading hierarchy, from summary figures at the top of the dashboard down to detail by channel or campaign further below. Documenting the exact definition of each indicator directly within the tool avoids interpretation disagreements between people who consult the same report without having built its underlying queries.
What tools to use for a marketing dashboard
A spreadsheet such as Excel or Google Sheets remains a common starting point for a first marketing dashboard, especially when the number of sources to cross reference stays limited. This approach, however, requires regular manual updates, which quickly becomes time consuming once several channels need to be tracked in parallel.
Dedicated visualization solutions, such as Looker Studio, connect directly to data sources and automatically refresh the charts displayed, without manual rework. More complete business intelligence solutions also exist for organizations that need to cross reference larger data volumes or apply access governance rules.
The choice between these options depends less on company size than on the number of sources to connect and the expected consultation frequency. A team that checks its dashboard once a month does not face the same constraints as a team adjusting advertising budgets on a daily basis.
Common mistakes to avoid
The first mistake consists of stacking up displayed indicators with no direct link to a tracked objective. A dashboard that reproduces every metric available in each source tool quickly becomes unreadable and stops being consulted day to day.
The second mistake stems from the lack of a shared definition for the same indicator across teams. A conversion rate calculated differently depending on the channel, or a notion of session counted differently between two tools, distorts comparisons and fuels avoidable debates during performance reviews.
The last frequent mistake consists of building a single dashboard for audiences with different needs. Leadership expects a summary of trends, while an operational team needs detail by campaign or channel: mixing these two reading levels into a single report harms its usefulness for both audiences.
Frequently asked questions
What types of indicators should a marketing dashboard distinguish?
A marketing dashboard generally distinguishes three families of indicators. Outcome indicators measure the final impact of actions, such as attributed revenue or return on investment. Activity indicators track the volume of actions taken, such as the number of campaigns launched or content pieces published. Audience indicators, such as traffic or reach on social media, complete this view by situating the scale of the exposure obtained.
What is the difference between an operational dashboard and a strategic dashboard?
An operational dashboard tracks the detail of a channel or campaign on a day to day basis, with frequent updates meant to adjust ongoing actions quickly. A strategic dashboard instead consolidates an overall view over a longer period, monthly or quarterly, designed to surface trends rather than to manage daily detail.
How many indicators should a marketing dashboard track?
There is no universal number to follow, the right choice depends on the objective pursued and the intended level of reading. A summary dashboard benefits from limiting itself to a small number of directly actionable indicators, while a more detailed view, reserved for in depth analysis, can include more without harming its readability.
What tools allow building a marketing dashboard without technical skills?
A spreadsheet such as Excel or Google Sheets allows getting started without particular technical skill, provided manual data updates are accepted. Dedicated visualization solutions, such as Looker Studio, connect directly to data sources and automatically refresh the charts, without requiring development skills.
How often should a marketing dashboard be updated?
The frequency depends on the intended level of steering. Tracking an active advertising campaign benefits from a daily or weekly update to adjust budgets in time, while tracking an underlying trend, organic positioning or brand awareness, is better suited to a monthly reading.